
The State of the Texas Woman is a biennial report released after every midterm and presidential election. It contains important trends and patterns of women+ running for office down to the county level. Both quantitative and qualitative data points are reported, giving our readers a better understanding of what it takes to run for office in the Lone Star State. Currently, Lone Star Parity Project is the only entity to landmark a report with aggregated data down to the countywide level.
Click the drop down menu below to find out how many women+ filed for, ran for, and won elected office during the 2024 election cycle.
Filing for office means an individual submitted an application for a spot on the ballot. In a campaign, filing to run for office is the first step. Below is a chart that shows how many women+ filed. More Republican women filed for office than Democratic women. However, similar to the trend in the 2022 midterm election, Democratic women+ made up a greater percentage of all Democratic filers than Republican women+ compared to Republican filers.
| Total Individuals | Women | Men | |
|---|---|---|---|
| Total Filed | 4,517 | 1,145 (25.3%) | 3,372 (74.7%) |
| Democrats | 1,202 | 437 (36.4%) | 765 (63.6%) |
| Republicans | 3,315 | 708 (21.4%) | 2,067 (78.6%) |
Primary elections only exist in partisan elections, meaning candidates who run for a specific political party. The goal of a primary election is to narrow down the candidate representing a party (e.g. Democrat or Republican) in the November general election. 3,019 total candidates won their primary election, including both contested and uncontested races.
Uncontested Primaries
Uncontested primaries are primary elections where only one individual from a certain party filed to run for a specific position and won by default. 2,059 people ran uncontested in their primary election. 626 of those uncontested candidates were women+, making up roughly 30.4% of uncontested primary candidates.
Contested Primaries
Contested primaries are primary elections where more than one individual from a certain party filed to run for a specific position. Our contested primary statistics include results from runoff elections, which are special elections where a majority winner was not established in a crowded primary election and the top two candidates run against one another again. 960 individuals won their contested primary election. 219 of those winners were women+. That means 22.8% of contested primary winners were women+.
| Total Individuals | Women | Men | |
|---|---|---|---|
| Total Uncontested Winners | 2,059 | 626 (30.4%) | 1,433 (69.6%) |
| Total Contested Winners | 960 | 219 (22.8%) | 741 (77.2%) |
| Democrat Primary Winners | 769 | 332 (41.9%) | 447 (58.1%) |
| Republican Primary Winners | 2,250 | 523 (23.2%) | 1,727 (76.8%) |
General elections are elections where the candidate with the most votes wins the position. Midterm general elections occur every four years and generally include most countywide and statewide races. For the 2024 election cycle, the general election occurred November 5, 2024.
2,600 people won their general election. 673 of the total people that won their general election were women+. That means 25.9% of winners were women+. A majority of the individuals that won their general election ran in uncontested races.
| Total Individuals | Women | Men | |
|---|---|---|---|
| Total General Winners | 2,600 | 673 (25.9%) | 1,927 (74.1%) |
| Total Uncontested Winners | 2,150 | 546 (25.4%) | 1,604 (74.6%) |
| Total Contested Winners | 450 | 127 (28.2%) | 323 (71.8%) |
| Democrat General Winners | 498 | 192 (38.6%) | 306 (61.4%) |
| Republican General Winners | 2,102 | 481 (22.9%) | 1,621 (74.1%) |
| Elected Offices At or Above Parity | # of Women Elected (2024) | % of Women Elected (2024) |
|---|---|---|
| Joint County Clerk/District Clerk | 8 | 100.0% |
| Railroad Commissioner | 1 | 100.0% |
| County Clerk | 11 | 91.7% |
| County Treasurer | 20 | 90.9% |
| District Clerk | 10 | 90.9% |
| Probate Court Judge | 4 | 80% |
| County Tax Assessor-Collector | 90 | 79.8% |
| County Criminal Court at Law | 3 | 75% |
| County Judge | 2 | 66.7% |
| Criminal Judge | 4 | 66.7% |
| Texas Court of Appeals Justice | 22 | 55% |
| County Court at Law Judge | 15 | 51.7% |
| Texas Court of Criminal Appeals Justice | 1 | 50% |
| State Board of Education Member | 4 | 50% |
| Most Populous Elected Offices | # of Available Offices (2024) | % of Women Elected (2024) | Parity Level |
|---|---|---|---|
| County Constable | 648 | 4.3% | Far Below |
| County Commissioner | 513 | 10.1% | Far Below |
| Sheriff | 244 | 4.1% | Far Below |
| County Tax Assessor-Collector | 238 | 79.8% | At or Above |
| District Judge | 235 | 44.7% | Near |
| County Attorney | 192 | 32.3% | Below |
| State House Representative | 150 | 35.3% | Below |
| District Attorney | 80 | 26.3% | Below |
| Justice of the Peace | 76 | 43.4% | Near |
| Texas Court of Appeals Justice | 40 | 55% | At or Above |
| U.S. House of Representatives | 37 | 18.9% | Far Below |
| County Court at Law | 29 | 51.7% | At or Above |
| County Treasurer | 22 | 90.9% | At or Above |
| State Senator | 15 | 40% | Near |
| Counties | # of Available Seats (2024) | # of Women+ Elected (2024) | % of Women+ Elected |
|---|---|---|---|
| Dallas | 7 | 5 | 71.4% |
| Crockett | 6 | 4 | 66.7% |
| Glasscock | 6 | 4 | 66.7% |
| Howard | 8 | 5 | 62.5% |
| Bailey | 7 | 4 | 57.1% |
| Travis | 14 | 8 | 57.1% |
| Armstrong | 4 | 2 | 50% |
| Borden | 4 | 2 | 50% |
| Castro | 6 | 3 | 50% |
| Edwards | 6 | 3 | 50% |
| Hansford | 6 | 3 | 50% |
| Kenedy | 6 | 3 | 50% |
| Lamb | 6 | 3 | 50% |
| Lynn | 4 | 2 | 50% |
| McColloch | 6 | 3 | 50% |
| Sterling | 6 | 3 | 50% |
| Upton | 6 | 3 | 50% |
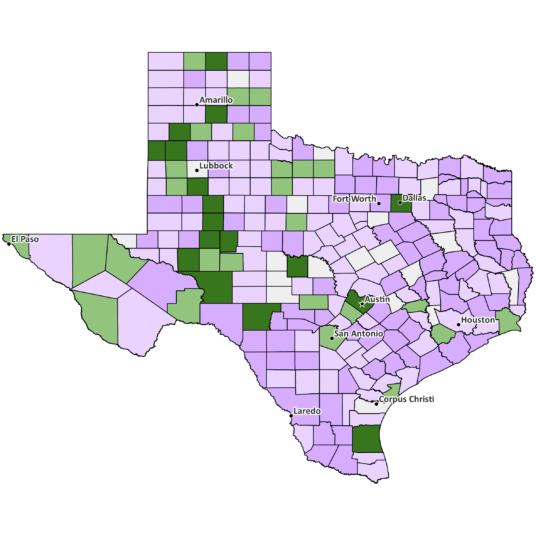
Geographic representation across the state is an important intersection of parity. This is a map showing parity levels by county. Only 17 of the 254 counties elected candidates at parity in 2024, all of which are listed in the chart above. Counties in West Texas saw the largest regional increase in women’s representation, as shown in the map below. 10 more counties reached parity in 2024 election cycle than in the 2020 election cycle.
On top of crunching the numbers from the 2024 election cycle, we also interviewed women+ from across the Lone Star state. Use the scroll bar on the right-hand side then click each feature to expand their picture and read their story.
You can download, compare, and share our past reports.